Headline ratio
3.50×
Canada vs Poland (card)
One URL for editorial teams: headline stats, publication-ready chart assets, suggested headlines, reusable attribution, and canonical links — all CC-BY-4.0.
One-line summary
In matched card routes, Canada median retail BTC buy cost is 3.50× higher than Poland (4.90% vs 1.40%), using country medians from Augea's public benchmark data.
Headline ratio
3.50×
Canada vs Poland (card)
Median card cost
2.03%
Across 10 countries
Card vs bank gap
9.67×
Cross-country median card-to-bank ratio
Citation-ready stats · source-backed, not marketing proof
Each card shows one report-backed number with its full evidence frame attached: source, edition, captured-at date, methodology, and license. Use these when the stat will be republished or excerpted alongside attribution. Estimates, not quotes.
HEADLINE RATIO
3.50×
Country median pair on matched card routes
Canada (4.90%) vs Poland (1.40%), card rail
Estimates, not quotes. Country medians from snapshot-backed pricing windows; values may shift with FX, fees, and market conditions.
MEDIAN CARD COST
2.03%
Cross-country median for card routes
Across 10 tracked countries on the matched benchmark slice
Estimates, not quotes. Country medians from snapshot-backed pricing windows; values may shift with FX, fees, and market conditions.
CARD VS BANK GAP
9.67×
Cross-country median card-to-bank ratio
Card-rail median divided by bank-rail median across the same country set
Estimates, not quotes. Country medians from snapshot-backed pricing windows; values may shift with FX, fees, and market conditions.
Press-kit charts
Download dark, white, or SVG versions of each chart. Every asset is CC-BY-4.0. Use the white variants when republishing on light editorial surfaces. Click any on-page preview to enlarge.
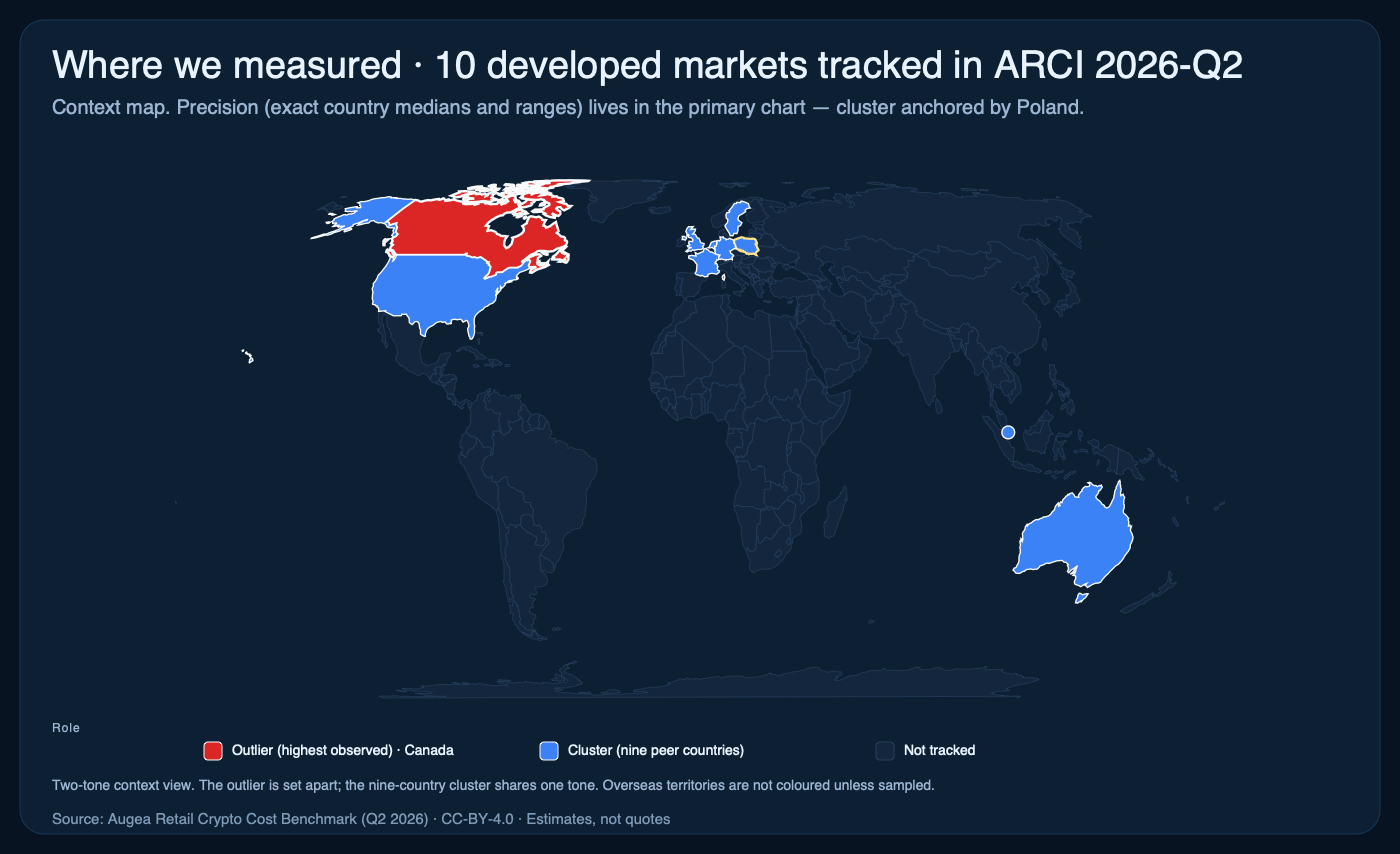
Focus map
Cropped for readability across tracked regions. Use when precise geography labels must stay legible.
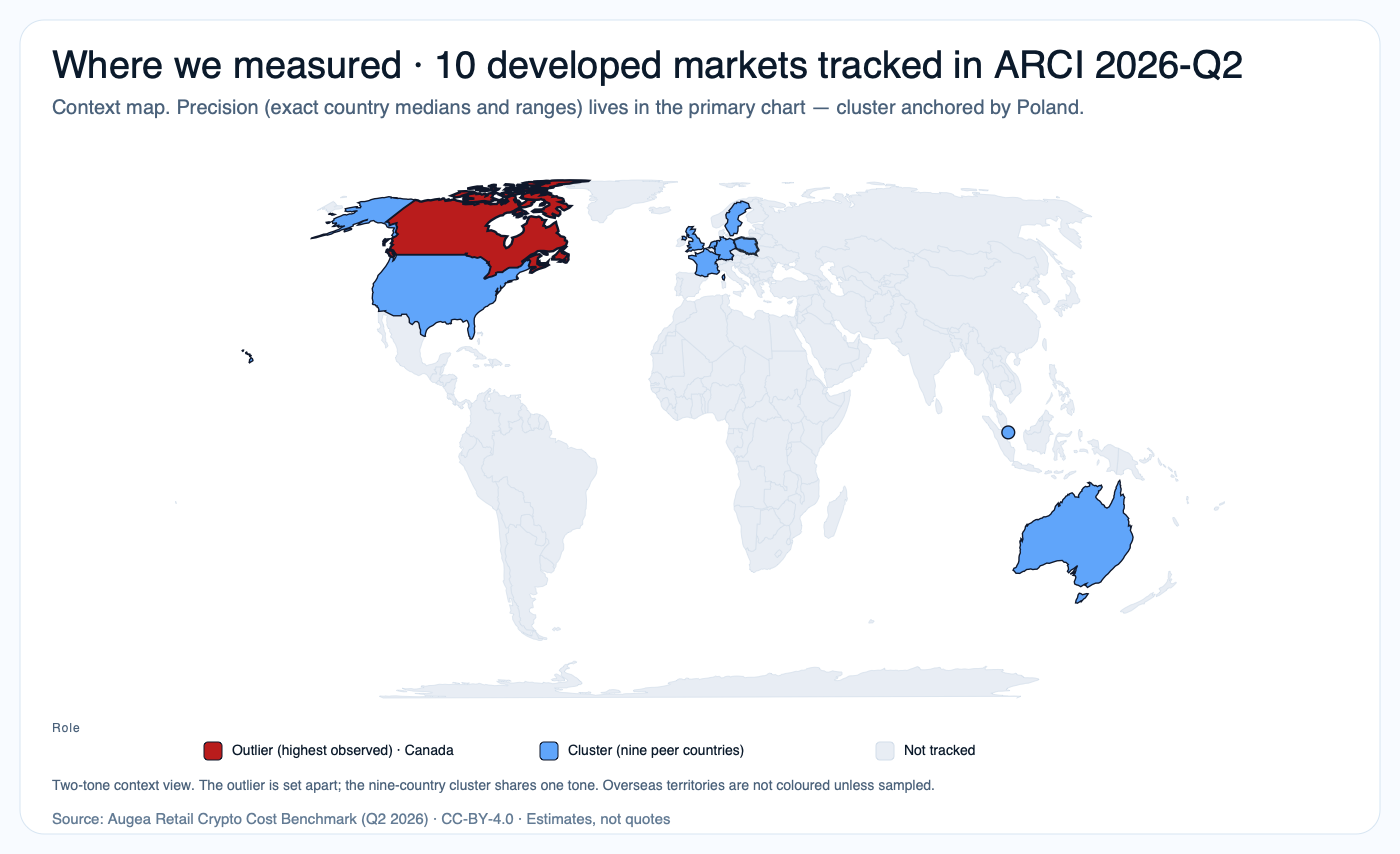
World map
Same benchmark slice at full-world scale for broad geography context in editorial layouts.
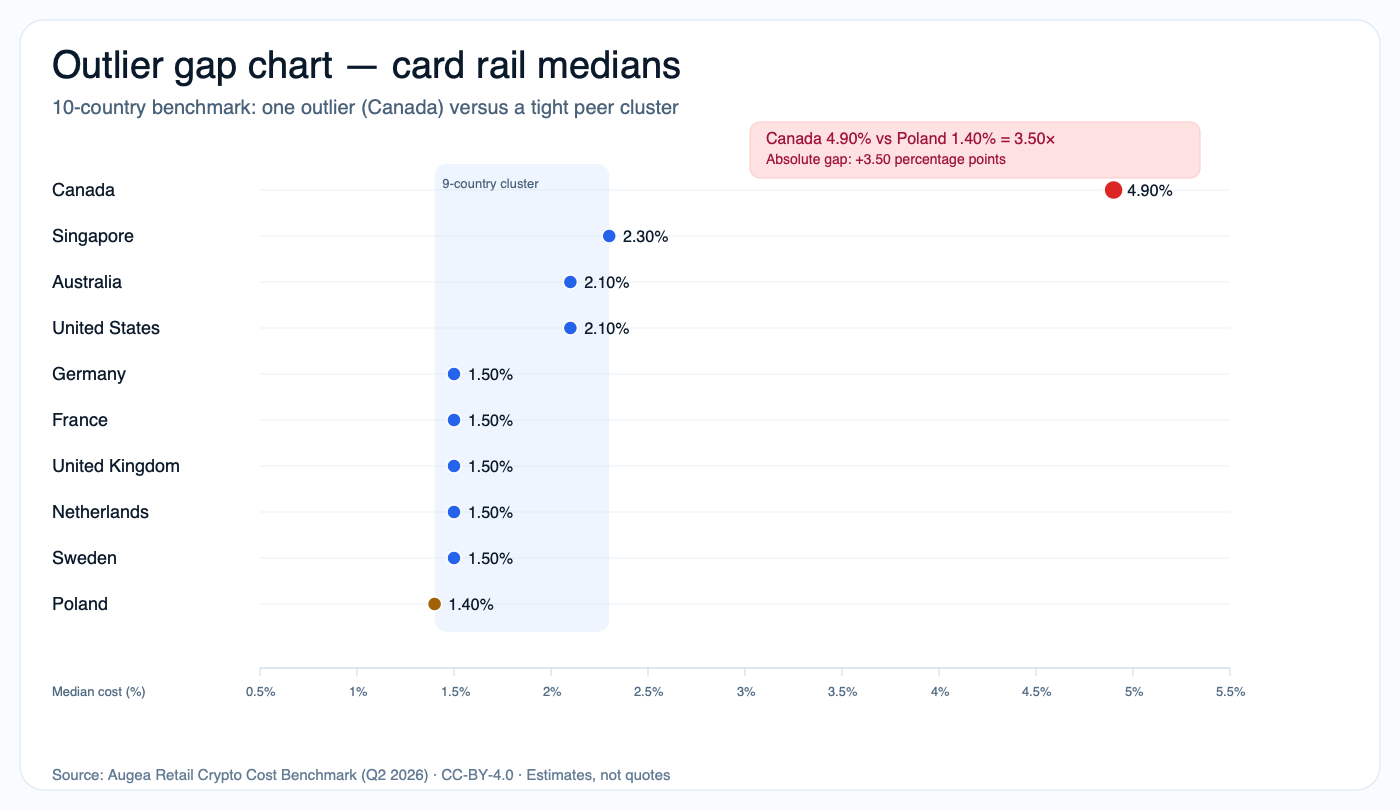
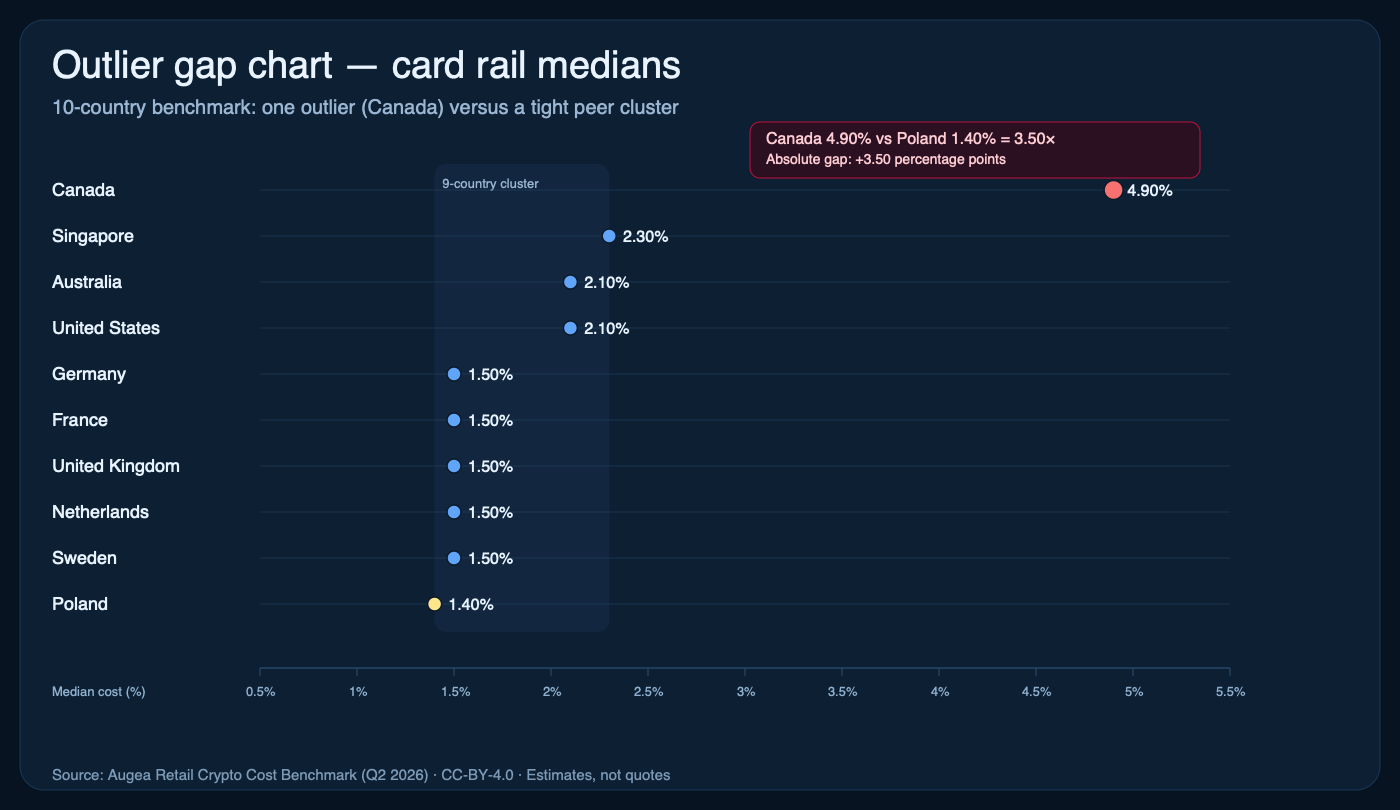
Outlier gap chart (card rail)
Primary editorial chart: one-country outlier versus a tight 9-country cluster on a shared axis.
Alt: Outlier chart showing Canada as a clear cost outlier versus the 9-country card-rail cluster.
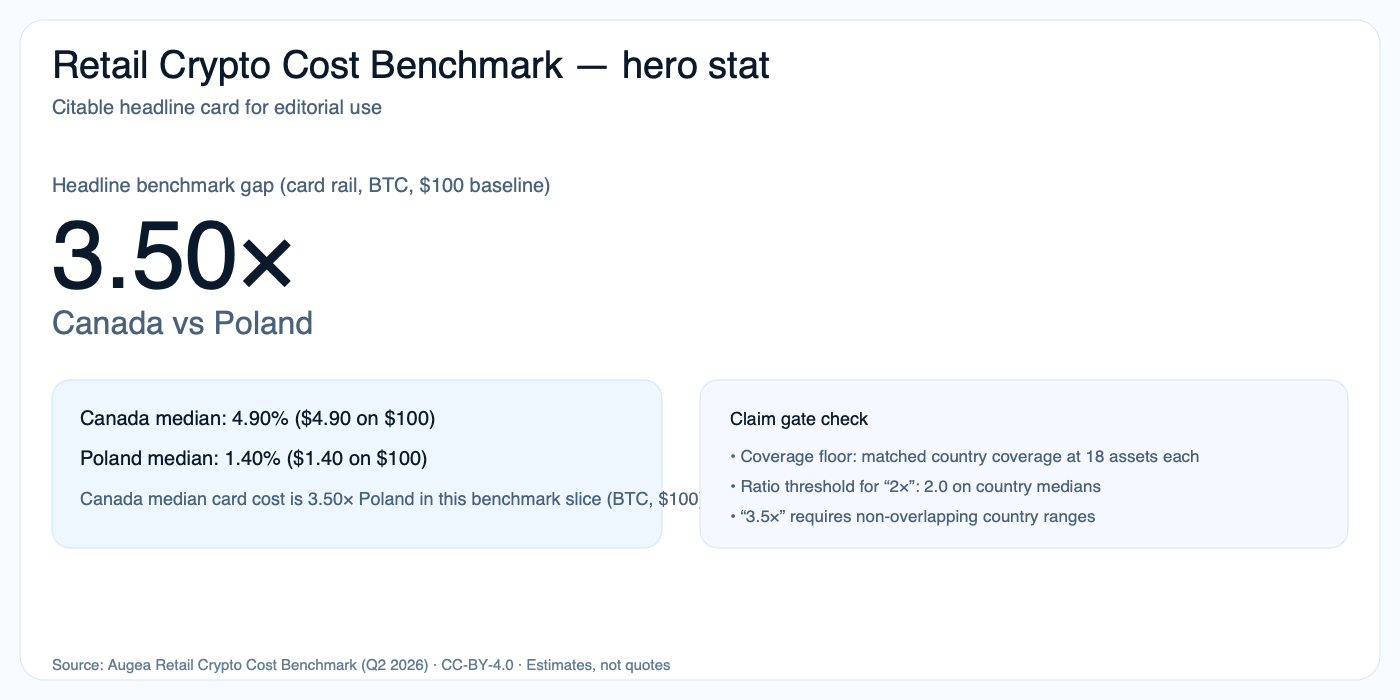
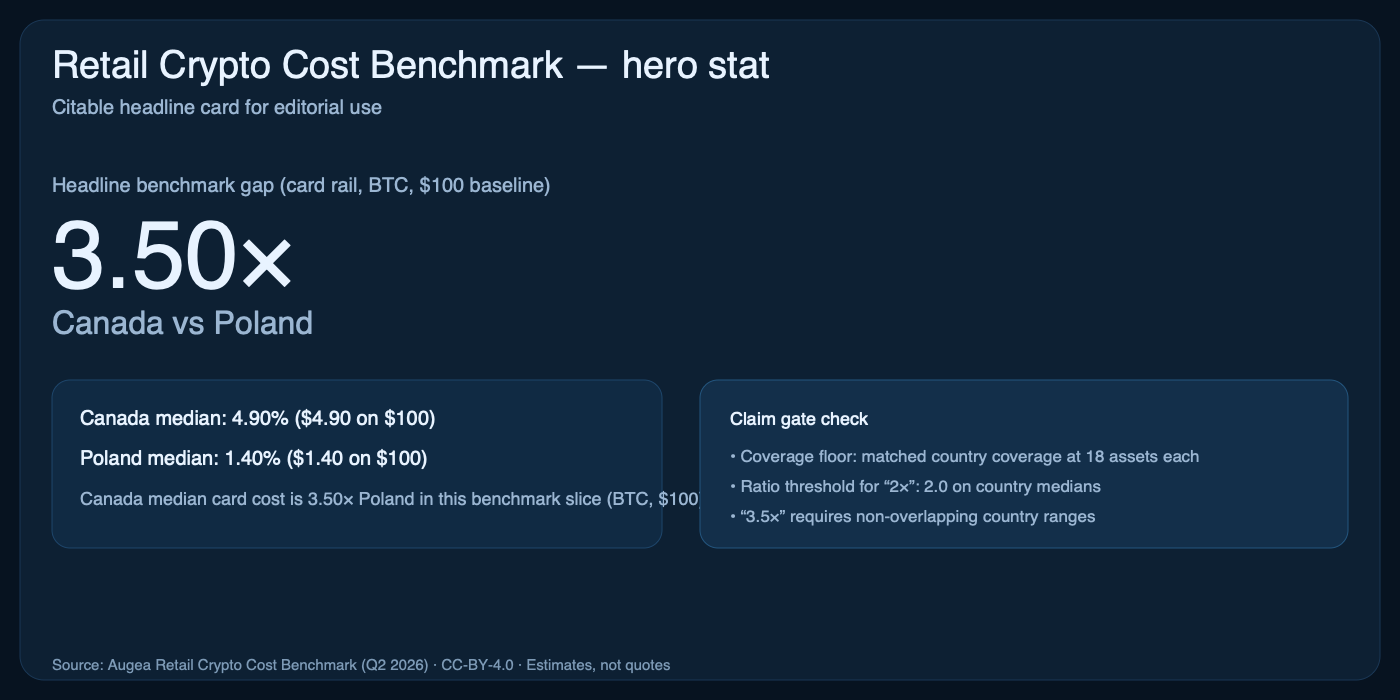
Hero stat card
Claim-gated country pair headline comparison at $100 baseline.
Alt: Hero benchmark card showing Canada vs Poland at 3.50× on card routes.
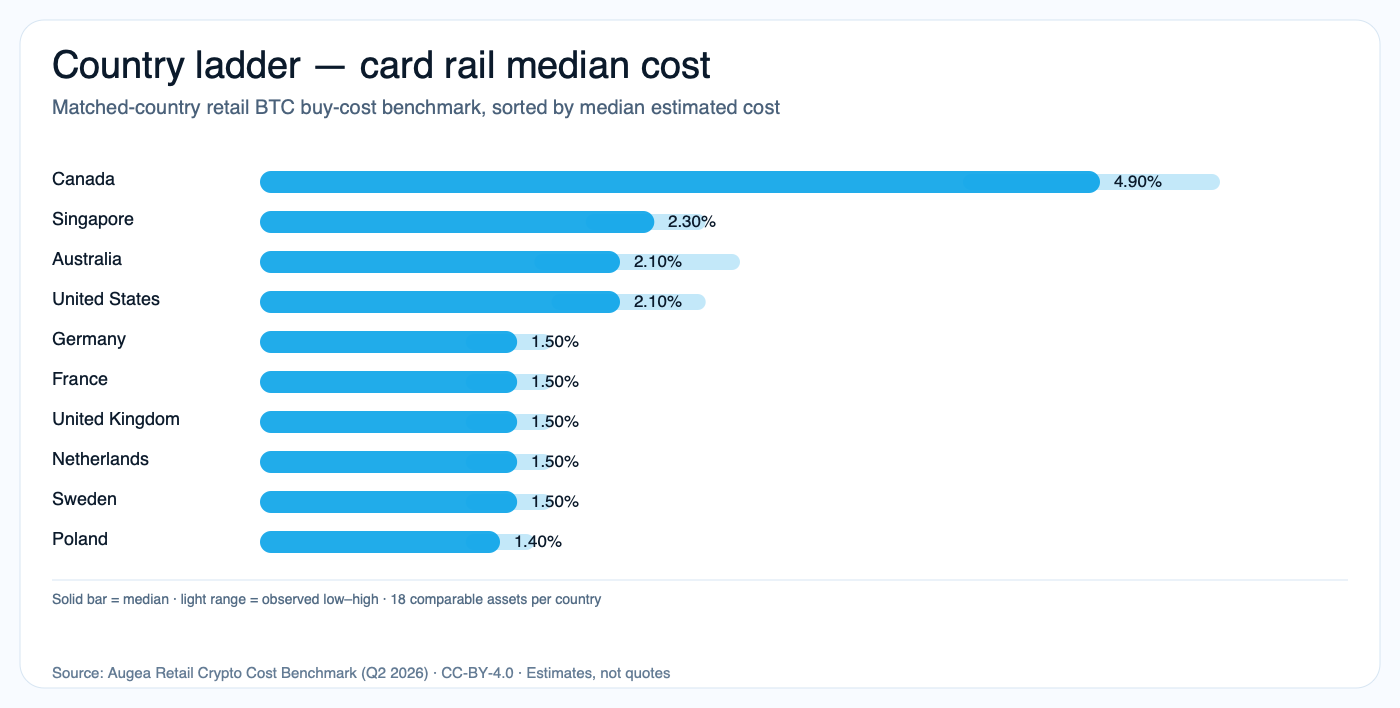
Country ladder (card rail)
Country medians for card routes in the matched benchmark slice.
Alt: Horizontal country ladder ranking median card costs for the benchmark countries.
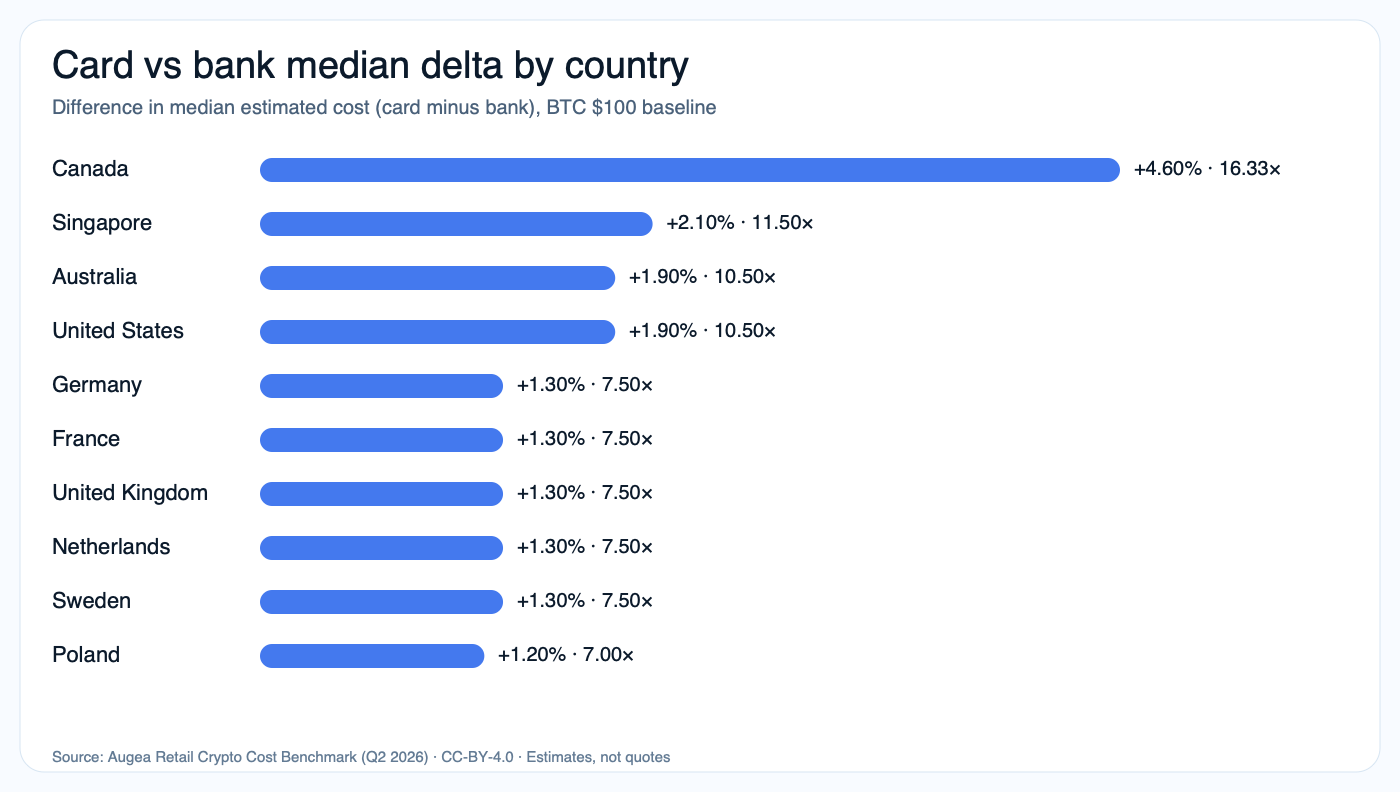
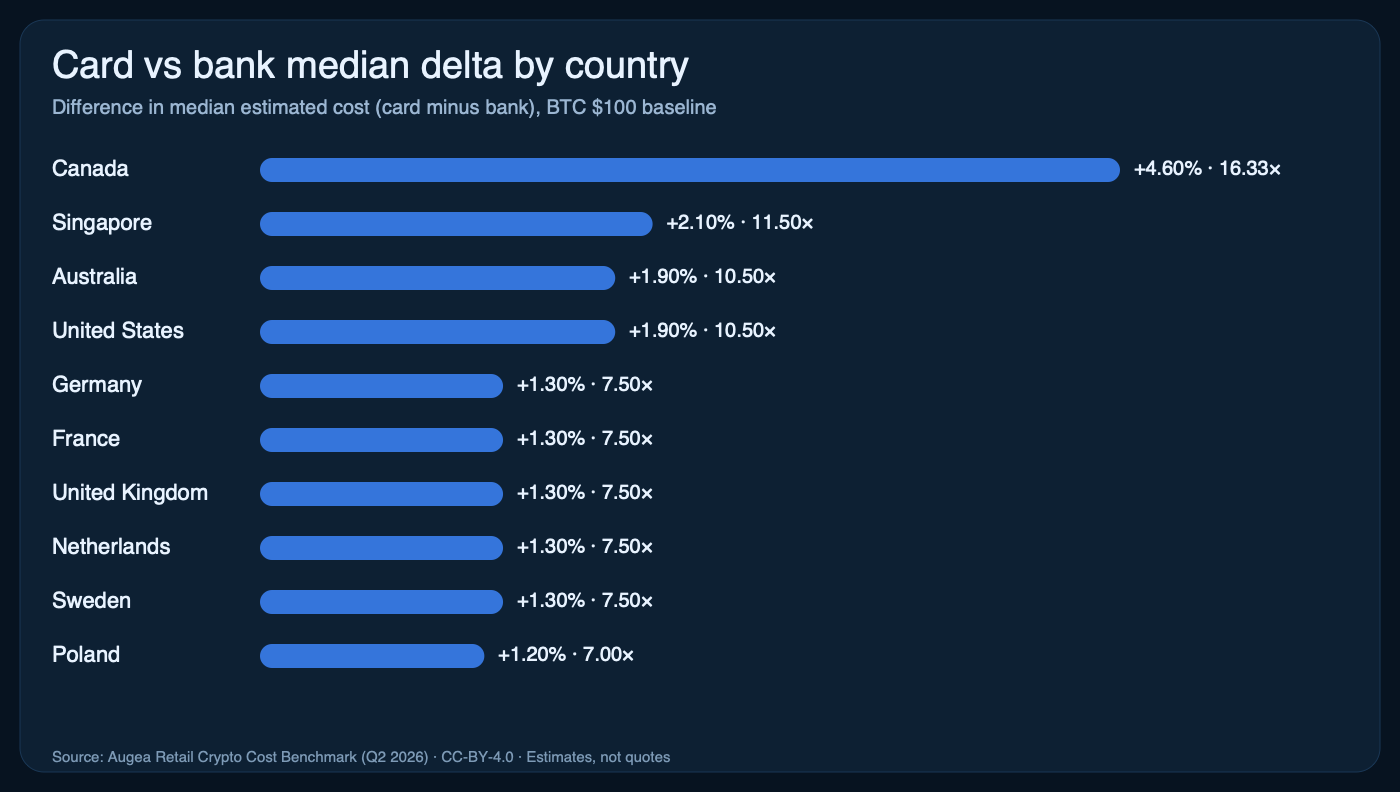
Card vs bank delta
Within-country card premium versus bank transfer medians.
Alt: Bar chart showing card minus bank median percentage-point deltas by country.
Context map (card rail)
Two-tone context map: outlier (Canada) versus the nine-country cluster. Precision lives in the chart and grid, not the map.
Alt: World map with the outlier country set apart from the nine-country cluster in a single tone.
Geography context only. Use the panel on the right for exact medians and ranges.
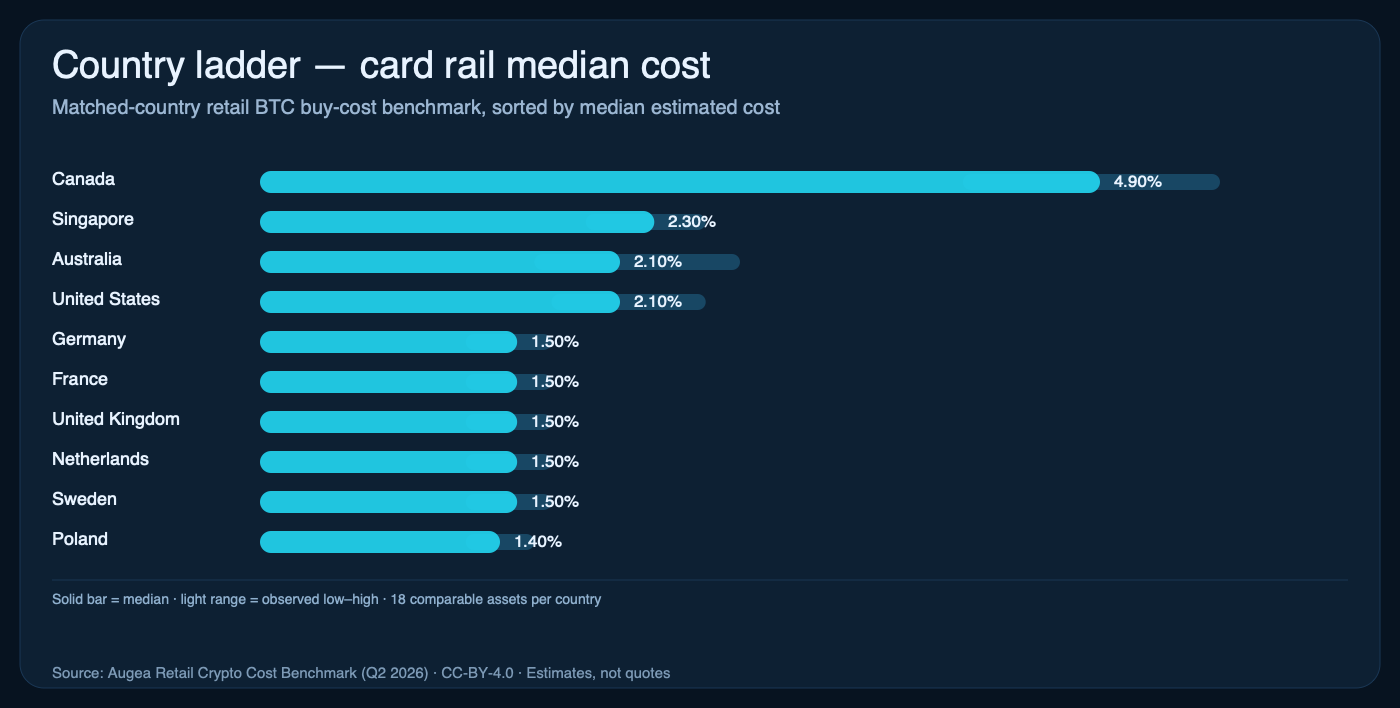
On-site quick view
Native dark-theme version of the country ladder, rendered directly from the benchmark data in the Augea design system. For publish-ready exports, use the downloads above.
Country medians for card routes. Solid bar = median; light range = observed low–high.
Solid bar = median · light range = observed low–high · 18 comparable assets per country
Augea's Q2 2026 benchmark compares retail BTC buy costs across 10 countries and two payment rails. Using snapshot-backed country medians, the study shows material cost dispersion by market and consistent card-premium behaviour versus bank transfer.
Embed this chart
Use the edition-locked ARCI dispersion card iframe when you want the benchmark to remain linked to source, methodology, and license in one reusable object.
Embed URL · dark
https://augea.io/embed/arci/dispersion-card?theme=dark&edition=2026-q2
Embed URL · light
https://augea.io/embed/arci/dispersion-card?theme=light&edition=2026-q2
Iframe snippet
<iframe
  src="https://augea.io/embed/arci/dispersion-card?theme=dark&edition=2026-q2"
  title="Augea Retail Cost Index · Dispersion card (Q2 2026)"
  width="920"
  height="760"
  style="width:100%;max-width:920px;border:0;overflow:hidden"
  loading="lazy"
  referrerpolicy="strict-origin-when-cross-origin"
></iframe>
Data source: Augea, Retail Crypto Cost Benchmark (Q2 2026)
Report: https://augea.io/reports/retail-crypto-cost-benchmark-2026-q2
Methodology: https://augea.io/methodology/retail-crypto-cost-benchmark-v1
Data appendix: https://augea.io/data/reports/retail-crypto-cost-benchmark-2026-q2
License: CC-BY-4.0
Press contact
Per Englund · hello@augea.io
Data source
Live country summaries (card + bank) · Latest captured /cheapest snapshot (Q2 2026)
Primary links