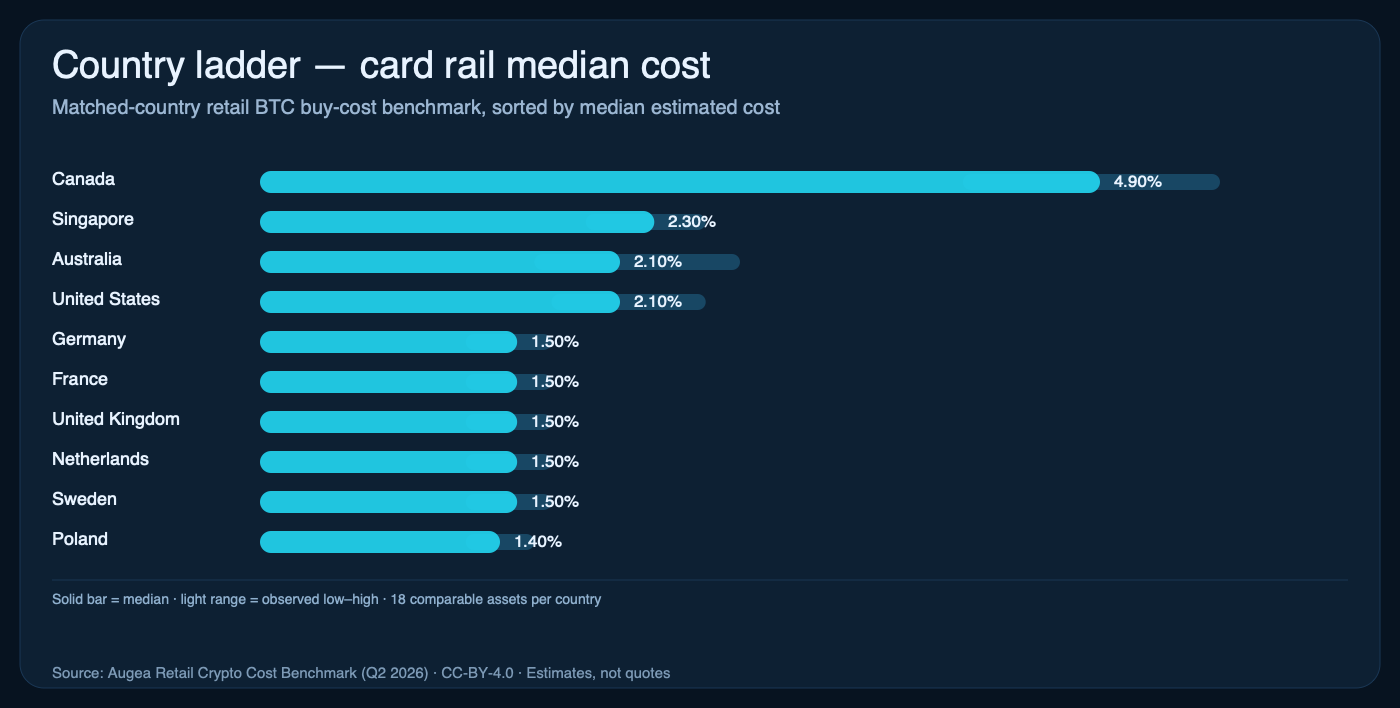
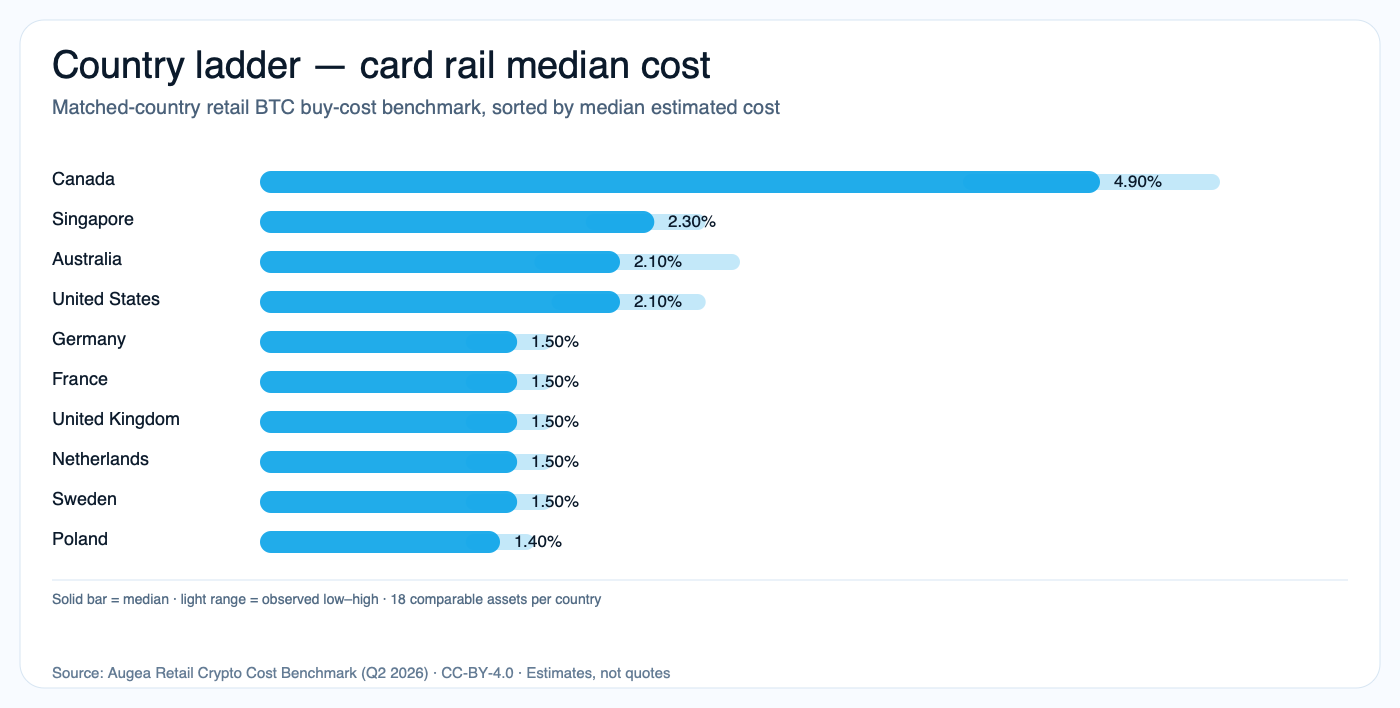
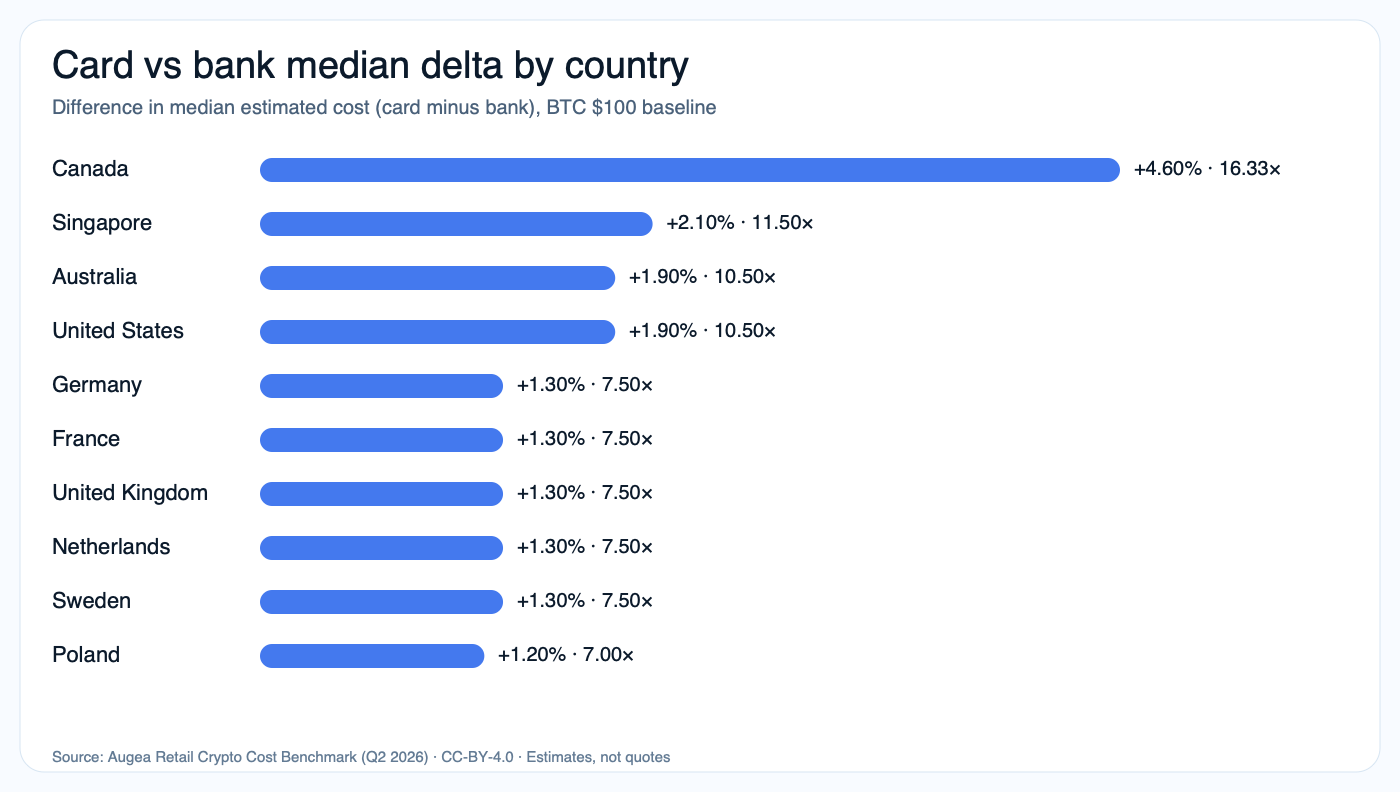
Card rail · BTC · matched $100 baseline · n=10
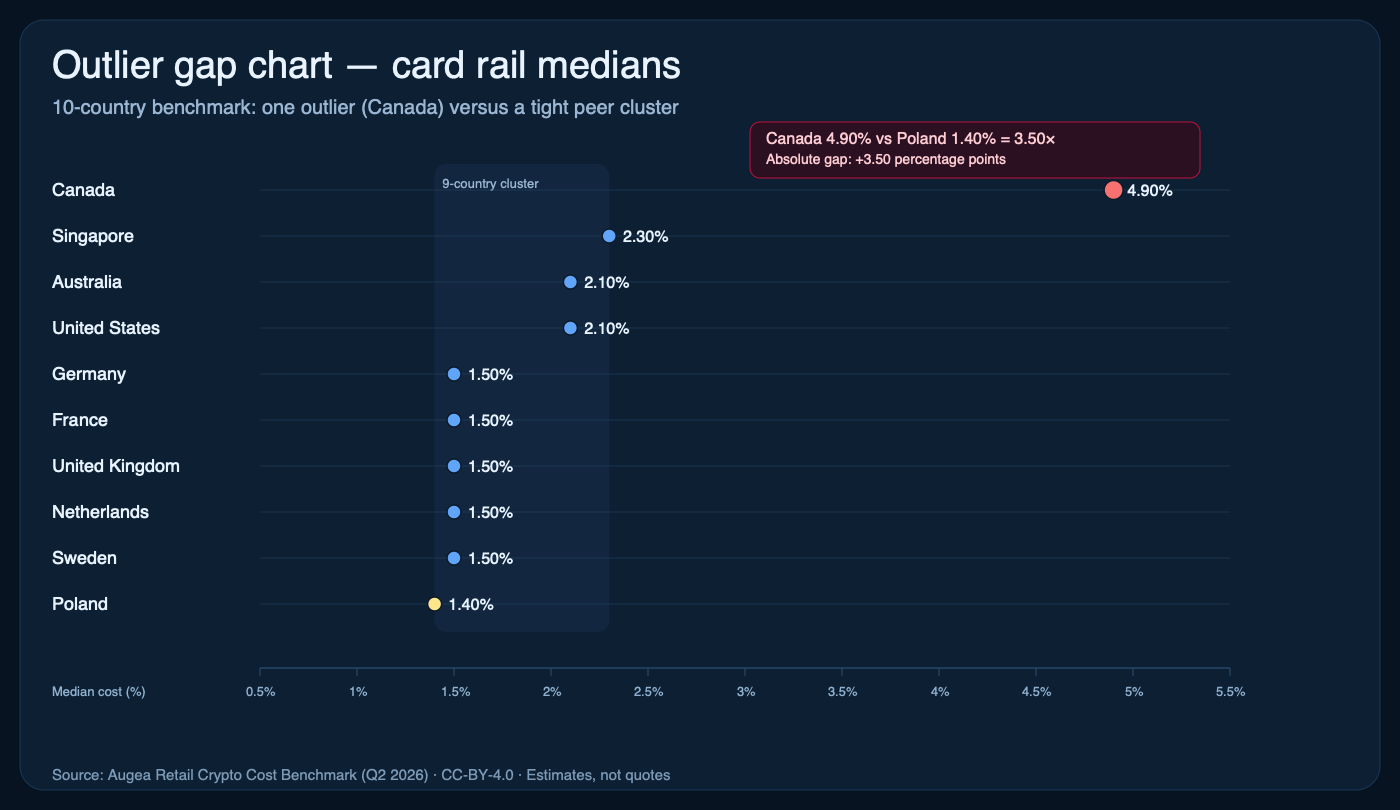
Canadian retail buyers pay 3.5× more than Polish buyers on card-rail BTC.
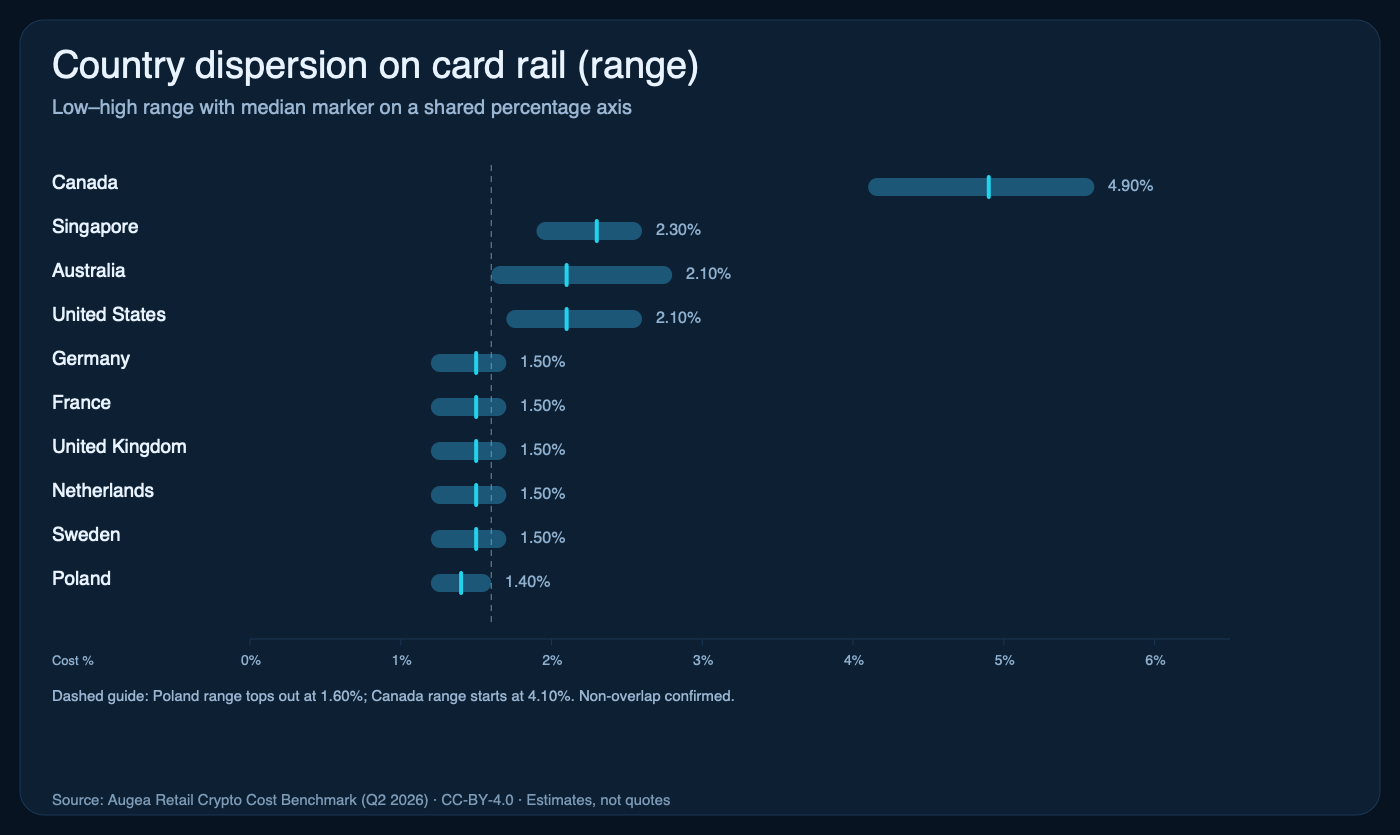
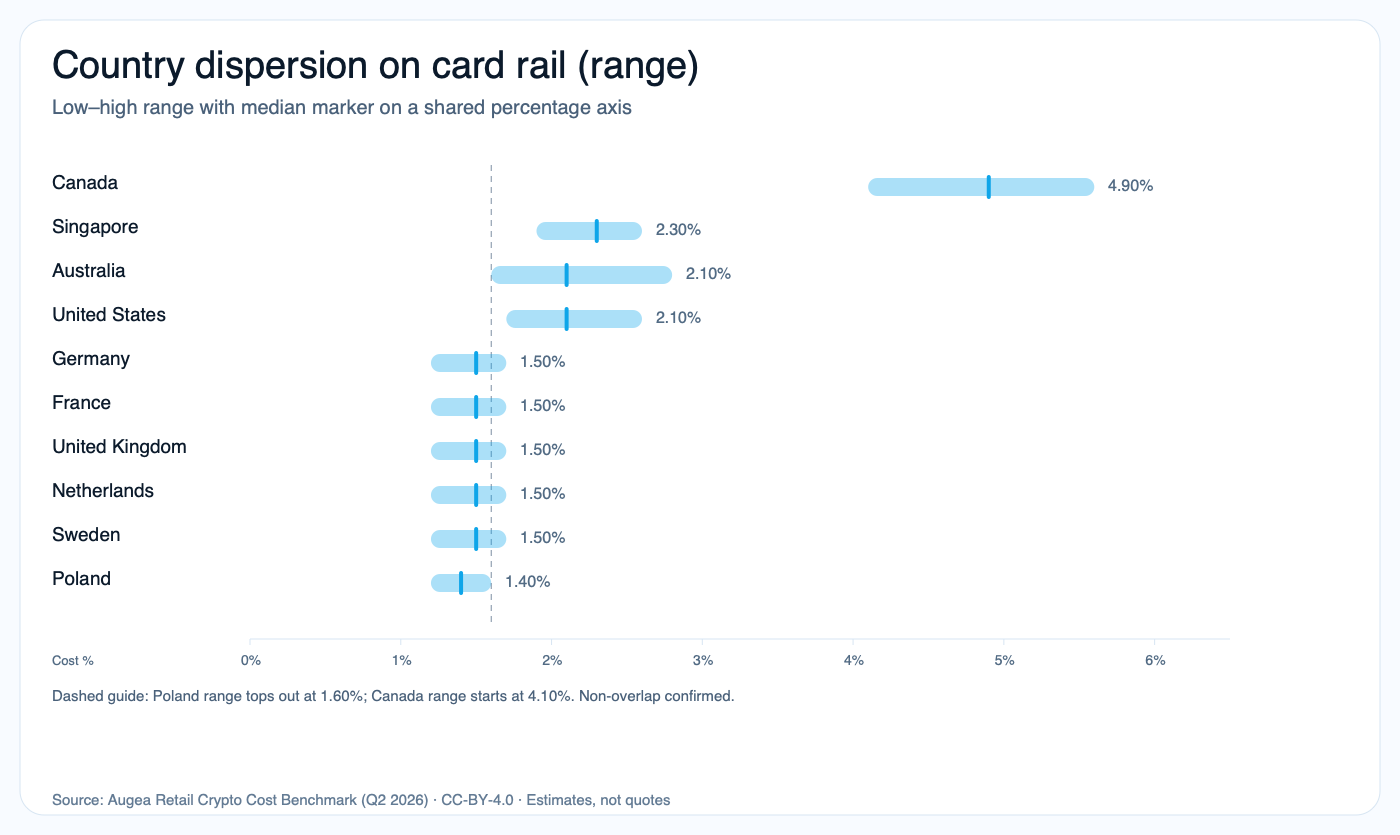
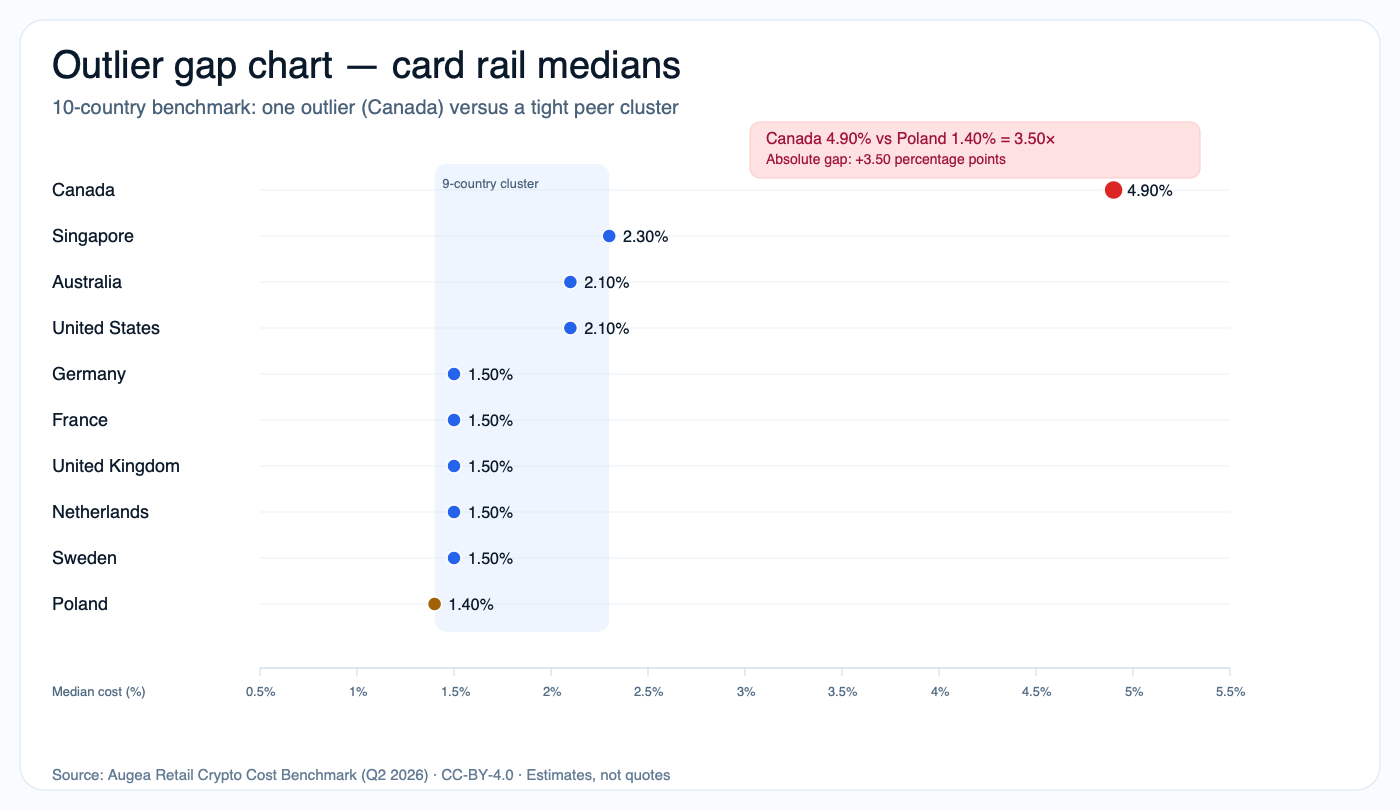
Country medians across 10 developed markets. Bars show the observed low–high range; dots mark country medians. Observed ranges between Canada and Poland do not overlap.
Compared pairOutlier · Canada 4.90%Low anchor · Poland 1.40%
Canada 4.90% vs Poland 1.40% = 3.50×
Absolute gap: +3.50% percentage points
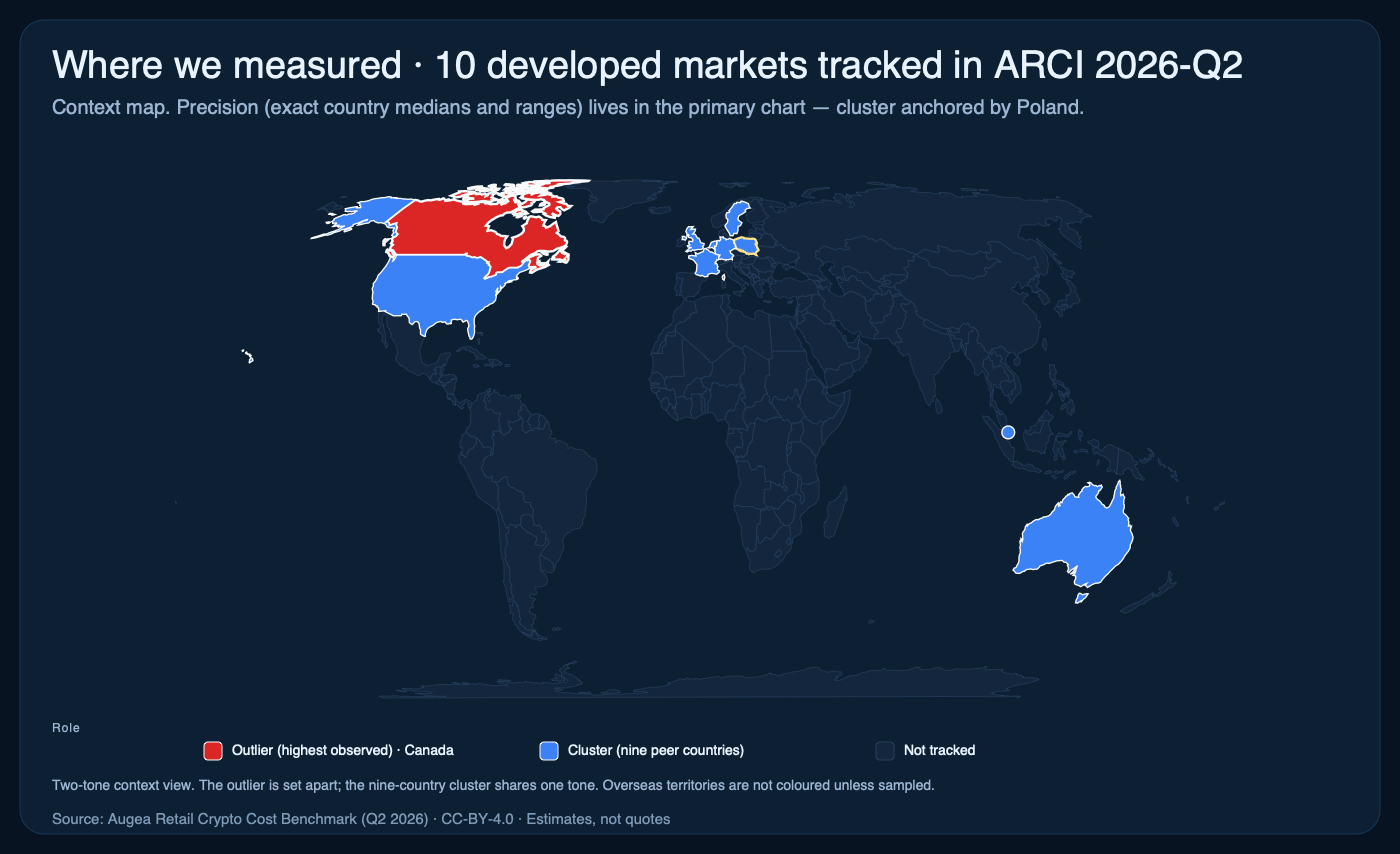
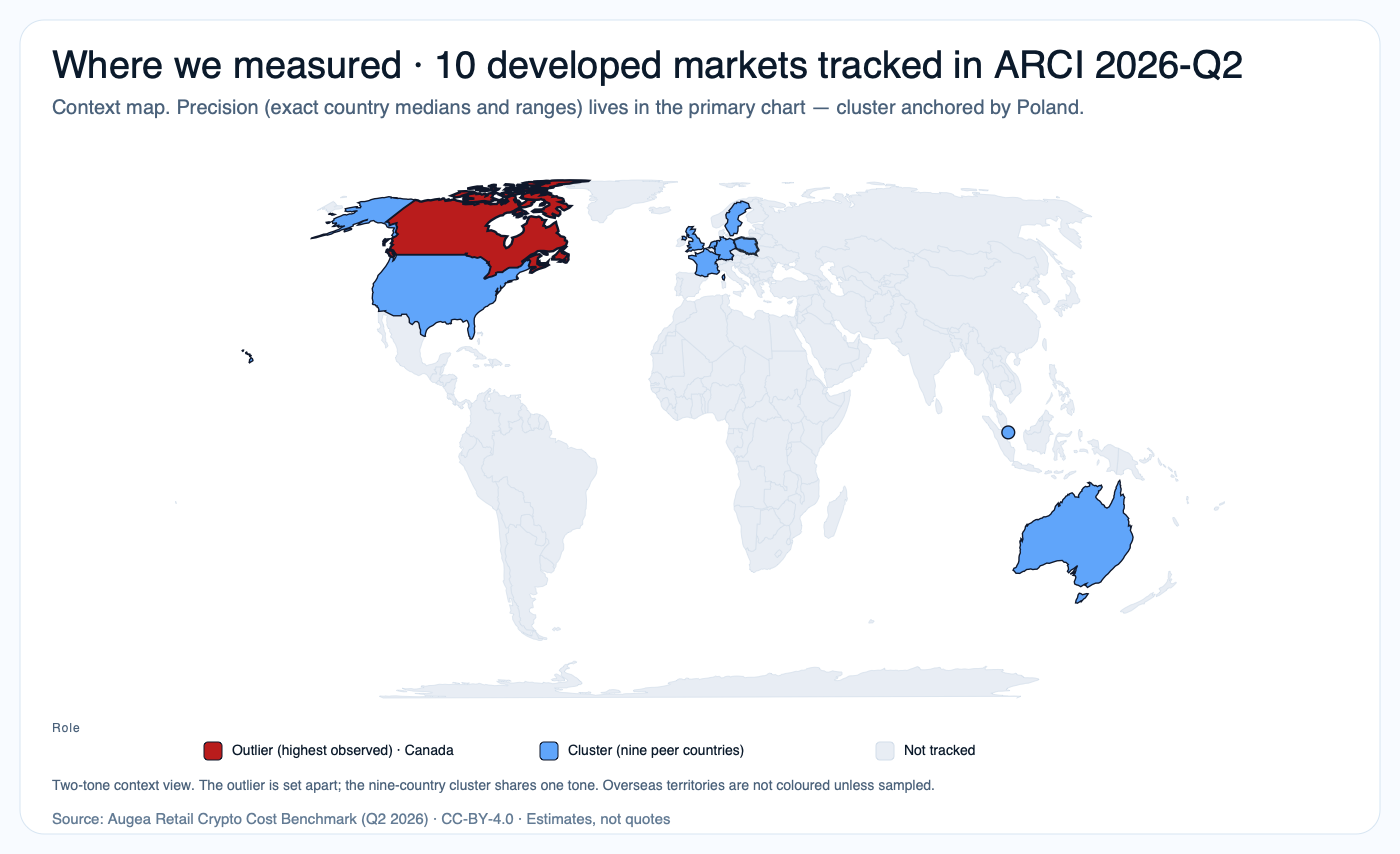
OutlierLow anchorPeer cluster
Canada
Canada median 4.90%, observed range 4.10% to 5.60%
4.90%Outlier
9-country cluster · 1.40%–2.30% medians
Singapore
Singapore median 2.30%, observed range 1.90% to 2.60%
2.30%
Australia
Australia median 2.10%, observed range 1.60% to 2.80%
2.10%
United States
United States median 2.10%, observed range 1.70% to 2.60%
2.10%
Germany
Germany median 1.50%, observed range 1.20% to 1.70%
1.50%
France
France median 1.50%, observed range 1.20% to 1.70%
1.50%
United Kingdom
United Kingdom median 1.50%, observed range 1.20% to 1.70%
1.50%
Netherlands
Netherlands median 1.50%, observed range 1.20% to 1.70%
1.50%
Sweden
Sweden median 1.50%, observed range 1.20% to 1.70%
1.50%
Poland
Poland median 1.40%, observed range 1.20% to 1.60%
1.40%Low anchor
0%
1%
2%
3%
4%
5%
6%
Median retail buy cost, % of $100 matched baseline